The Fibonacci Range Expansion Trading technique is one that I developed back in the early 1990s when I was moving away from lagging indicators like RSI, MACD, moving averages etc. I had no success using those indicators and came to the conclusion that either I didn’t understand them, or that they simply didn’t work. The only thing that I had any success with was trendline breaks, Fibonacci points, and standard pivots with the reading of pure price action. I was taught that in order to be successful in this business of trading, you need a few components.
According to my mentor and senior treasurer, Aldo Pizzoferrato, trading required BMG, or Brains, Money, and Guts. You need the brains to anticipate market momentum and to be a step ahead of the herd. You need capital to advance, and finally, you need the guts to believe in yourself and your systems. Therein lies the problem for most traders. Most traders operate on the simplest level. They have no real trading plan and view charts and price action using gut feel or really just guesswork. Aldo stressed upon me that the most effective approach was acting like a quarterback of a football team. I need to send the signals, by reading the market and finding weakness in the markets’ defenses. He would always say, “Don’t just receive the signals, send the market some feedback.” I had learned that trading is not a spectator sport. In other words, the most effective approach is in the development of systems that generate buy and sell signals. I had to move from “chart artist” to a true technician.
This trading technique that I am about to share with you will help you pick clear and defined points to enter into low-risk and high-reward trades. No longer will you have the excuse of trading with the rear-view mirror. The market will unfold its weakness, and you as a quarterback, will be able to make the audible call.
The Fibonacci Range Expansion Trading Zone Technique
Overview:
Price movements, up and down, very rarely continue uninterrupted. There are always counter trends to the main trend and at some point in time the trend will no longer continue to be your friend. The trend one day has to end.
The Fibonacci range expansion trading zone system attempts to capitalize on counter trends within a trend or even catch trend reversals. With the FRETZ (Fibonacci Range Expansion Trading Zone) we will use three distinct formulas.
1. The range of yesterday’s daily bar, which is the H-L= x
2. Pivot point Calculation of the daily range from yesterday.
3. Fibonacci retracement levels inside the Fibonacci Range Expansion that we will calculate.
1. The range of yesterday’s daily bar, which is the H-L= x
2. Pivot point Calculation of the daily range from yesterday.
3. Fibonacci retracement levels inside the Fibonacci Range Expansion that we will calculate.
Set up:
On the close of the previous daily bar we gather the following information: the high, low and close. Calculating the set up of USD/JPY on the close of June 3, 2010 will obviously be for the trading day of June 4, 2010.
The high was – 92.80
The low was – 92.04
The close was 92.59
The low was – 92.04
The close was 92.59
We first calculate the daily range which is the high minus the low.
92.80-92.04= .76
92.80-92.04= .76
Once the true range is calculated we multiply by the Fibonacci Range Expansion ratio of 1.618. Thus .76 x 1 .618 = 1 .2300
We then add and subtract this factor from the close to get the upper and lower Fibonacci range expansion values. The close of the upper Fibonacci expansion value is 92.59 + 1.23 = 93.82. The close of the lower Fibonacci expansion value is 92.59 – 1.23 = 91.36. These levels are what I call a mini market trench. If price breaks above or below the levels the market is telling me there is a potential shift in supply or demand. So these points are like a fence around the price action of yesterday. It is important to note that 85% of the time the markets trade in a range, and these levels will be excellent buy or sell zones. We will now continue to build our FRETZ matrix. We will add pivot points from yesterday’s range onto our charts. This is a standard pivot point formula, and I will add a downloadable calculator in the near future. However, you should know what the formula is:
We then add and subtract this factor from the close to get the upper and lower Fibonacci range expansion values. The close of the upper Fibonacci expansion value is 92.59 + 1.23 = 93.82. The close of the lower Fibonacci expansion value is 92.59 – 1.23 = 91.36. These levels are what I call a mini market trench. If price breaks above or below the levels the market is telling me there is a potential shift in supply or demand. So these points are like a fence around the price action of yesterday. It is important to note that 85% of the time the markets trade in a range, and these levels will be excellent buy or sell zones. We will now continue to build our FRETZ matrix. We will add pivot points from yesterday’s range onto our charts. This is a standard pivot point formula, and I will add a downloadable calculator in the near future. However, you should know what the formula is:
Base Pivot:
Pivot Formula = High+Low+Close/3= Base Pivot
Resistance 3 = High + 2*(Pivot – Low)
Resistance 2 = Pivot + (R1 – S1)
Resistance 1 = 2 * Pivot – Low
Resistance 2 = Pivot + (R1 – S1)
Resistance 1 = 2 * Pivot – Low
Support 1 = 2 * Pivot – High
Support 2 = Pivot – (R1 – S1)
Support 3 = Low – 2*(High – Pivot)
———————————————————————–
Support 2 = Pivot – (R1 – S1)
Support 3 = Low – 2*(High – Pivot)
———————————————————————–
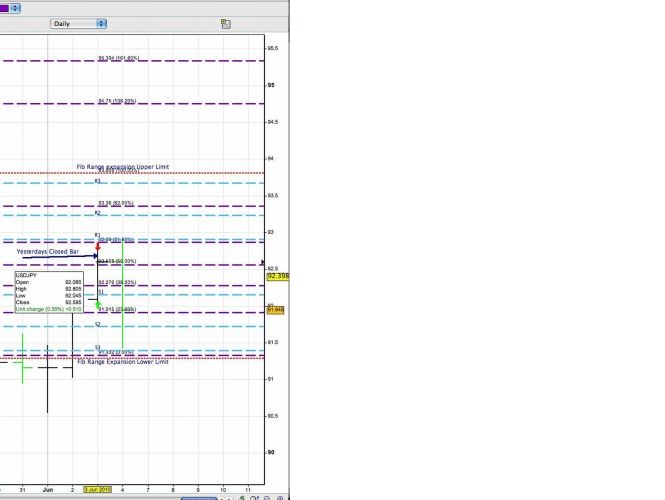
The third and final part of the Fibonacci expansion trading zone matrix is using your Fibonacci retracement tool. I would suggest changing the .786 level to .8200. I have found that the 82% works a bit better in foreign exchange trading. I know it’s not much of a difference, but I am always striving for perfection. Here is a rule when applying the retracement levels: If the close of yesterday (the bar we’re using) was a down close mark (less than the open), start from the lower level first and then retrace upwards to the upper Fibonacci expansion level. Conversely, if the close on yesterday’s bar was at an up close mark (close greater than the open), start from the upper expansion level first and then retrace down to the lower level. This idea keeps in line with my Fibonacci Strike System.
Now That we have all of these levels plotted, our matrix is set. We will use these levels as support and resistance. The closer the pivots and the Fibonacci Levels are to each other, the stronger the level will be. It’s important to note that if the market “zooms” through these levels, a shift has occurred in supply or demand. If you are on the wrong side, escape quickly (First Rule Of Trading is to preserve capital!) I use a simple trend line as a trigger to enter long or short and the Fibonacci and pivot levels as my resistance and support.
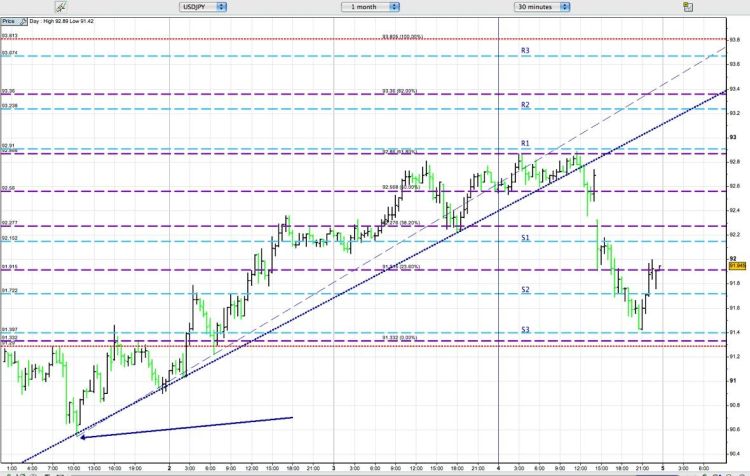
See Chart below for an explanation of trade that occurred in USD/JPY on June 4th 2010.
See Chart below for an explanation of trade that occurred in USD/JPY on June 4th 2010.
The chart above shows the full matrix constructed with the Upper Expansion level at 93.81 and the Lower Expansion Level at 91.36 (91.29 in this chart.) Also, note in trading the market that I pulled the lower expansion level down 7 pips as a warning. If USD/JPY broke all those tight levels that converged at 91.30-40 area, the move in my mind should be more violent.
I also just extended the trend line in this chart to extend out to infinity (it’s the red segment above).
Just to be clear, the light blue lines are the Pivot Support at Resistance Levels, and the purple lines are the Fibonacci Retracement levels calculated inside the range of the upper and lower expansion.
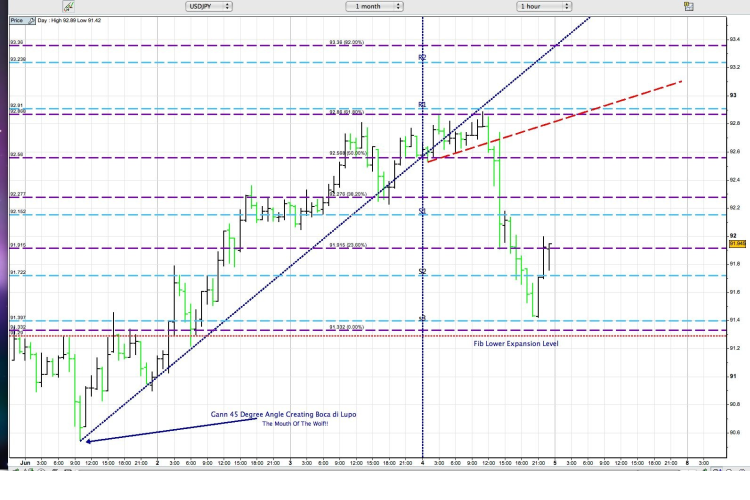
I added an advanced technique that I mentioned at one time or another: a Gann 45 degree angle of death from what was the closest Root Point low. A root point for me is the lowest low (or highest high). It’s the genesis of the up move (or down move.) I may confuse some here but study the chart. I picked the pivot low from where USD/JPY recovered and rallied up to 92.88 (this will now be the Root Point for the decline down to 91.42)
Just to be clear, the light blue lines are the Pivot Support at Resistance Levels, and the purple lines are the Fibonacci Retracement levels calculated inside the range of the upper and lower expansion.
I added an advanced technique that I mentioned at one time or another: a Gann 45 degree angle of death from what was the closest Root Point low. A root point for me is the lowest low (or highest high). It’s the genesis of the up move (or down move.) I may confuse some here but study the chart. I picked the pivot low from where USD/JPY recovered and rallied up to 92.88 (this will now be the Root Point for the decline down to 91.42)
When I add this Gann line, I create what I call Nella Bocca di Lupo – the price has entered in the “mouth of the wolf.”
It’s in this area where the support line and the Gann line create the upper and lower resistance. A vortex that once the support is broken should trade lower to the internal Fibonacci levels. I will then gauge price action to determine how strong the move appears.
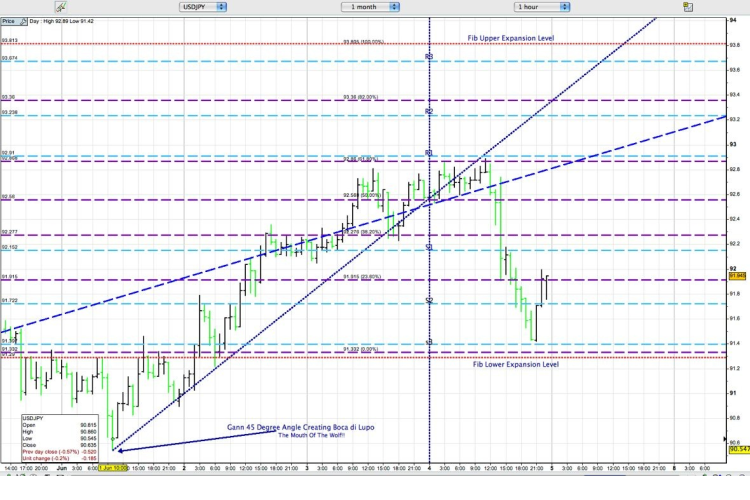
So how did I trade the USD/JPY?
The market price came up to the Fibonacci Retracement level at 92.88. There was a pivot R1 at 92.91 and the Gann line at approximately at 92.93. I sold the 92.83 level with a tight stop loss at 93.04 (markets tend to push one last time through a R1, so I need a little bit of cover) My first thought was that a 1:2 ratio was worth the risk, and I knew if the price could break the recent support at 92.66 Nella Bocca Di Lupo was in play! I should at least get a chance to scoop USD/JPY at 92.56 or better at 92.27 the lower Fibonacci levels. So the plan was to see if price could break the recent support and once it did how will it react? Will it get dull and stall or will it zoom through the Fibonacci Support of 92. 56? It zoomed through at that point I moved my stop Loss down to 10 pips above the entry price. I now need the Fibonacci level at 92.27 to break, and the S1 at 92.15 to go as well. I want you all to see how the market gave several opportunities to get involved in this short. Look how it retraced back up and slightly above the trigger line (old support line at 92.66) and failed. It then zoomed down through 92.27 and the S1 level at 92.15. It stopped dead cold at the 91.92 level. The market then rallied up to the S1 level at 92.15 (giving another opportunity for a short with a Stop Loss above the Fibonacci Level of 92.27) This is surgical accuracy, as a matter of fact its laser surgical Accuracy! Once the Market touched the 91.92 level, I moved my stop profit down to 92.37 just above the Fibonacci level, I was then planning on taking 1/3 my position off at the 91.72 S2 level. The market hit the S2 and 1/3 was taken off. I then moved my stop profit for 2/3 to the 92.15 level (the S1.)
The market came down within 7 pips of the S3 level (91.39ish) I scooped another 1/3 of the short at 91.51 and moved my stop profit down to S2 at 91.72 where the market decided to take me out. So, you see how important it is to send signals to the market, be that Quarter Back, and yes at times you will get sacked, but it’s all in the name of trading. After All…Profitable Trading Is Not A Spectator Sport!
No comments:
Post a Comment